What Is a Double Top?
A Double Top is a bearish reversal pattern that appears after an uptrend.It forms when the price reaches a resistance level twice, fails to break above it, and then starts to fall.It shows that buyers tried to push the price up twice, but sellers took control both times — indicating a potential trend change from bullish to bearish.
How to Identify a Double Top
1. First Top – Price rallies to a peak and then pulls back.
2. Second Top – Price rises again to roughly the same level, but fails to break higher.
3. Neckline – The lowest point between the two tops.
4. Breakdown – When the price breaks below the neckline, the reversal is confirmed.
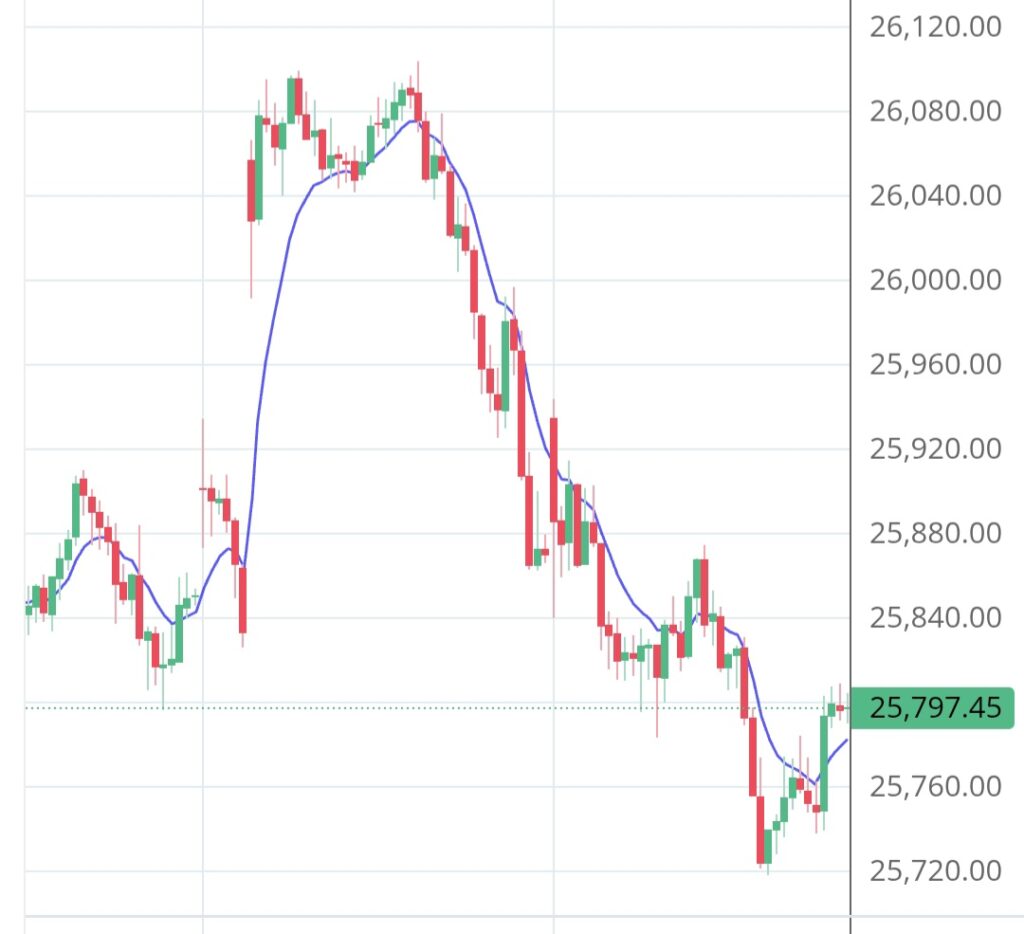
In the Chart Above:
The price made two strong pushes upward near 26,080 – 26,100 (forming the two tops).Both times, it failed to break higher — showing seller strength.Once the neckline (around 25,920) broke, the downtrend accelerated sharply.You can see a clear fall to 25,720, confirming the bearish reversal.
Pro Tip:
Traders often enter short positions after a confirmed neckline breakdown.For safer entries:Wait for a retest of the neckline after the breakdown.Use a stop-loss above the second top.Set your target equal to the height of the pattern (Top to Neckline distance projected downward).